Daily Market Analysis and Forex News
New FXTM commodity hits all-time high!

- FXTM launches 10 new commodities
- Cocoa hits fresh record high
- Biggest gainer YTD in FXTM’s commodity universe
- Prices up over 150% since the start of 2024
- Firmly bullish on H4/H1 timeframe
This week, FXTM launched 10 new commodities!
This now brings FXTM’s tally to 13 different commodities to trade from.
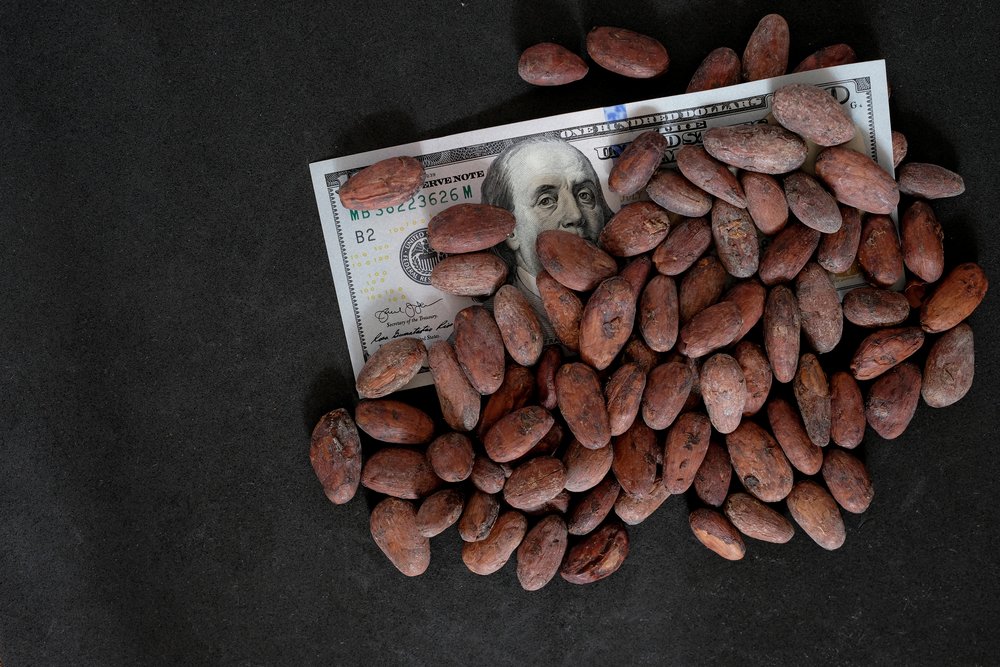
And Cocoa has certainly hijacked our attention, jumping to a fresh all-time high on Monday.
The commodity posted its highest-ever intraday price at $11345.56 (Monday, 15th April)!

Note: Cocoa is priced per metric ton (MT)
Before we take a deep dive into why Cocoa prices are skyrocketing, let’s cover some basics:
What is Cocoa?
Cocoa is refined from the seeds of a cacao tree, which is a key ingredient in chocolate production.
What does FXTM’s Cocoa track?
FXTM’s Cocoa tracks the ICE US Cocoa futures which is the world benchmark for the global cocoa market.
The lowdown…
Cocoa prices have seen extraordinary gains in recent months!
The commodity is up over 150% year-to-date as the industry faces a perfect storm.
A combination of bad weather, crop disease, and rising freight costs have led to sudden and aggressive increases in the price of Cocoa.
The bigger picture
Did you know the world’s two biggest producers of cocoa beans are based in West Africa?
The Ivory Coast and Ghana are the big boys when it comes to production, accounting for more than 50% of the world’s cocoa.
A weather phenomenon known as El Nino has been causing drier weather for these countries, negatively impacting crop yields as a result.
It does not end here
Meanwhile, the world’s appetite for chocolate remains robust!
According to the International Cocoa Organization’s (ICCO) latest forecast for the 2023/2024 cocoa year, demand is set to outstrip production by 374,000 tons.
What does this mean?
This could mean more gains for cocoa if demand continues to exceed world production which is anticipated to decline by almost 11% this year.
How about the technicals?
Prices are firmly bullish on the daily charts with the path of least resistance pointing north.
However, a technical throwback could be in the works before bulls jump back into the scene.
Key support levels can be found at $10717, 10485 and the psychological $10000.

Ready to trade with real money?
Open accountChoose your account
Start trading with a leading broker that gives you more.