
GUIDE | TRADING BASICS | ADVANCED
Bearish Candlestick Patterns
Learn to spot bearish candlestick patterns and the most suitable conditions for price action trading.
Trading is risky
Bearish Candlestick Patterns: Made Simple
Japanese candlestick charts took root in the ’80s and are incredibly popular with more serious traders. Glance into the complicated looking charts for the first time, and you may deem them difficult to understand.
If you’re starting from the very beginning, watch our video on Candlestick Charts.
Your starting point as a beginner to forex trading
The foreign exchange market, also known as the forex market, is the world’s most traded financial market. We’re committed to ensuring our clients have the best education, tools, platforms, and accounts to navigate this market and trade forex.
If you’re not sure where to start when it comes to forex, you’re in the right place.
You’ll find everything you need to know about forex trading, what it is, how it works and how to start trading.
What does the engulfing pattern say about the market?
The bearish-engulfing candlestick tells us that more sellers have entered the market. They outnumber the buyers, causing the prices to fall. This is in line with the rule of supply and demand. Each candlestick forms with a wick or shadow. If it appears on the bearish candlestick, it reveals that buyers tried to reject the dropping prices but were eventually overwhelmed. We say that the market is weakening, selling off, or there is increased supply.
What makes the sellers sell?
The most common explanation is that people who bought at lower levels of the upward trend are now taking their profits, since the upward trend couldn’t be sustained.
Trading on the upward trend
Bearish engulfing patterns may show up anywhere. However, they are most rewarding when you catch them just before the uptrend is reversed.
Can you act on a Bearish Engulfing Pattern during a downtrend?
The action you take depends on your risk-to-reward ratio. Even though uptrends are touted as the best place to act on a bearish engulfing pattern, you can also leverage the pattern during a downtrend.
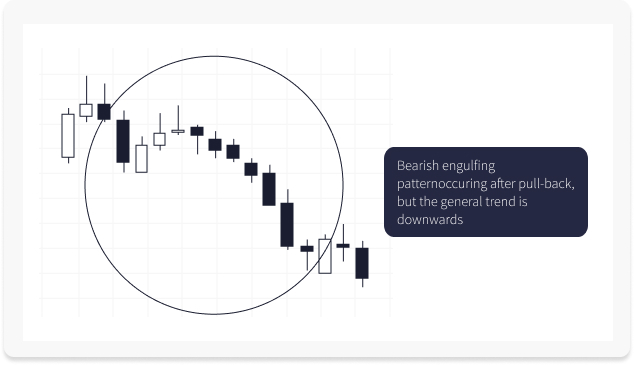
In this case, the bearish engulfing pattern will happen after a pull-back. However, the pressure should be on the prices to fall.
In the image on the right, we see a pull-back to the upside, followed by the formation of the bearish engulfing candlestick pattern. Prices then fall as the market is on a downtrend.
5 things to consider when analysing Bearish Engulfing Candlestick patterns
- Check if the bearish candlestick completely engulfs the bullish candle.
- You can spot market indecision if the candlestick has a short real body, but long shadows.
- Some traders wait for a second black or red candlestick, used as a confirmation of the bearish trend. It should have a long real body and close below the first black candle.
- You get a stronger signal if the engulfing candle closes well below the bullish candle and its shadow. If it partly engulfs the real body, check if you have a dark cloud cover pattern.
- While two small candlesticks may create a bearish-engulfing pattern, it’s better if they are large.
Ready to turn your knowledge into action?
Open your account or get back into trading right now.
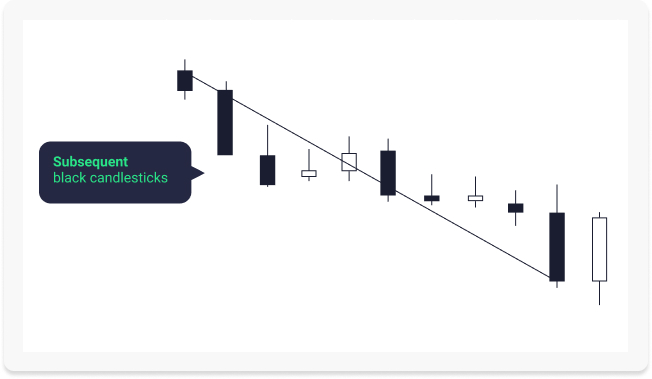
Consecutive Black Candlesticks
After the formation of the first bearish-engulfing pattern on the following daily chart, there is a second black candle. It shows that the downward trend might be for real.
Actions to take after spotting the pattern
Selling a long position
Your ECN broker automatically matches and executes the orders requested at the best available prices. You get immediate confirmation and, as there is no dealing desk involved, there are no re-quotes!
Entering a short position
Compared to standard brokers, your ECN brokerage can offer much tighter spreads as there is no ‘middleman’. Price quotations are gathered from numerous market participants, meaning ECN trading avoids wider spreads.
False Signal
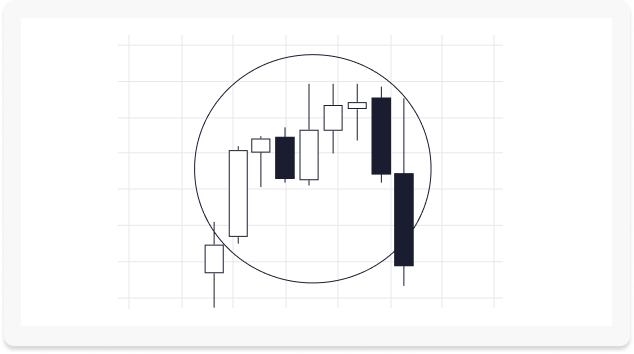
In this daily chart, there’s a strong upward trend. The red circle denotes a bearish engulfing pattern, but we don’t get a second black candle to confirm a reversal. It’s only several days later that we get an actual reversal of the strong upward trend.
There are also important differences between the first engulfing pattern and the second: On the first, we don’t see the most ideal pattern formation as it lacks a large gap up. The market sentiment is towards a bullish trend, and as the pattern didn’t result in a reversal, it is called a “false signal.”
For the second case, the bullish candle, with the short real body, has been sufficiently engulfed. You’ll also notice that the upper wick on the second black candle extends considerably showing that the buyers attempted to reverse the sentiment but met strong opposition from the sellers.
Actions to take after spotting a false signal
A stop-loss in a bearish-engulfing pattern
Since the bearish-engulfing pattern denotes a falling market, we put the stop-loss order at the extreme top of the pattern (the highest swing). The stop loss will be invalidated if the prices rise. Bearish engulfing patterns are suited for traders looking for day moves and want to take advantage of full-day swings. The validity of the stop-loss order should last until the end of the day.
Look out for sideways markets
Markets move up, down, or sideways. The bearish-engulfing pattern is not particularly favorable if the price action is not forming any trend. To deduce if the market is currently sideways, you need to establish the line of resistance (where sellers are willing to take profits) and support line (the level at which buyers are not allowing the prices to fall).
How to read Bearish Candlestick chart patterns with more certainty
There is a problem with relying on the bearish-engulfing pattern on its entirety to tell you the direction of the market. In addition to using support & resistance and trend analysis, consider learning about indicators.
What’s more, if you want to spot reversals, using indicators can help confirm the pattern.
Popular indicators include:
- MACD
- Volumns
- Accelerator Oscillator
- Relative Strength Indicator (RSI)
- Moving average
Volume Indicator Enhancing our Analysis of a Bearish Engulfing Pattern
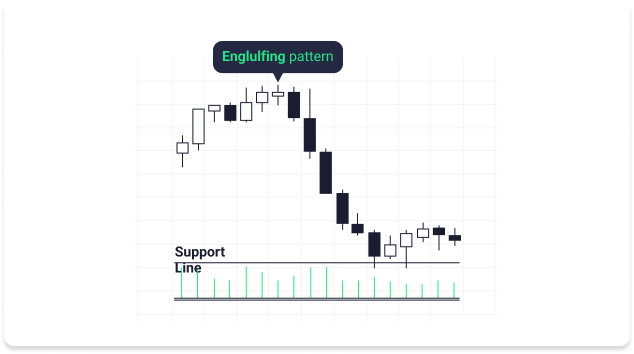
The bearish-engulfing pattern formation was accompanied by an increase in the market volumes, shown by the green line.
On the next day, the volume also increased as more sellers entered the market.
Many people in the market participated in the formation of the resulting reversal. However, fewer people participate in the formation of the engulfing pattern, you may conclude that the signal is not that strong. Indicators just give you more conviction as to the direction the market might move.
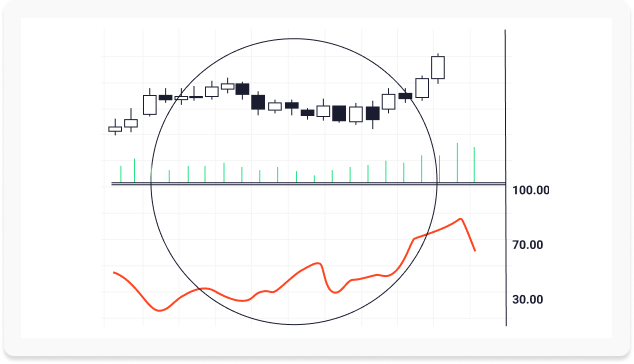
RSI Indicator & the Bearish-Engulfing Pattern
The RSI indicator tells us if the commodities or stocks in question have been overbought. Buyers have pushed the price high enough that no buyers are likely to enter the market at the current price level.
Some look-back periods for the RSI indicator include 2, 5, or 14 days. Now, during a 14-day look-back, if the RSI reads above 70, the conclusion is that the market has been overbought. We can, therefore, anticipate a reversal.
As shown in the figure on the left, when the bearish engulfing candle forms, you’ll notice that the RSI (14) has a value of 72. Subsequently, we see the market falling but since the predominant trend is upwards there is a pull-back.
Join FXTM today to trade with some of the best pricing in the business
It takes just minutes to create an account. Let’s get you started.